


DOGE is Based on a Lie
The federal workforce hasn’t grown in 50 years—so why is MAGA acting like it’s an emergency?


by Jeremy Novak
The Trump administration’s actions, especially through its pseudo-arm DOGE, suggest we are being oppressed by a suffocatingly bloated federal government.
With all the job firings and attacks on federal departments and programs going, there must be a national emergency, right? The government must be drastically reduced to stop this intrusive smothering of our personal lives and liberties!
Given the extreme measures being taken, it’s worth examining whether our government bureaucracy really is the raging behemoth Elon Musk and Donald Trump say it is. Is this an emergency from which Americans need immediate reprieve?
Using Bureau of Labor Statistics (BLS) data compiled by the St. Louis Fed’s online graphing service (FRED), let’s consider government employee data over the years. Below is a chart of all government employees from April 1959 through February 2025 1. Shaded areas are periods of economic recession:

Wow, as we can see, government went from roughly 8 million to almost 24 million employees during this span, an increase of essentially 200%—a full tripling of the size of government!! Talk about a bloated behemoth!
Not so fast.
The crucial context
At first glance, the raw increase in government employees might seem alarming. But numbers without context can be deceptive. We can’t just rely on absolute figures—we need to compare this growth to overall trends in the civilian labor force and the U.S. population.
If those things increased at the same or higher levels than the government employee population, then it would mean we’re not really in a crisis, and that the number of government employees has grown at the same levels of other population-related measures.
Below is a graph that adds in those other two sets of data:
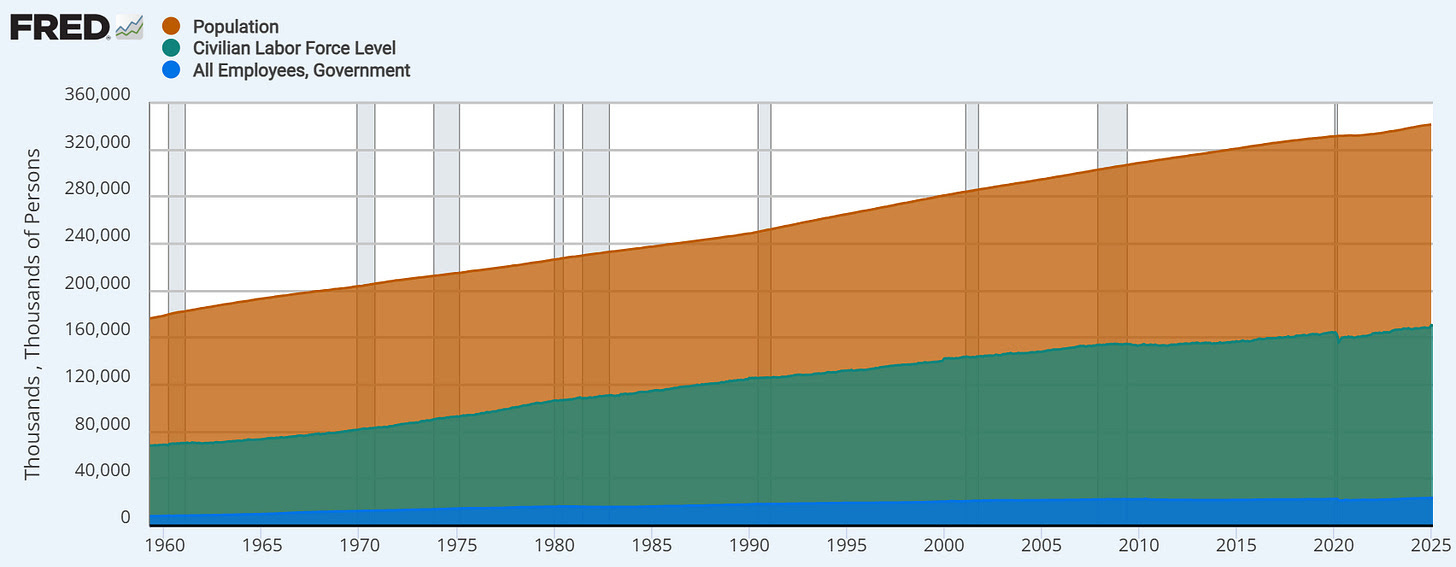
The scale of this graph can be misleading—it makes the labor force and population growth seem more dramatic than they actually are relative to government employment.
The civilian labor force level went from 68 million to 170.7 million, an increase of 150%; and the population level went from 176 million to 341 million, an increase of only 100%.
So the growth rate of government was more than double that of both the labor force and the overall population. So perhaps MAGA and DOGE have applied careful thought and analysis to their approach to this national nightmare, and are right about their concerns of a bloated, invasive government.
What “Government” really is
But wait a minute. We shouldn’t really be focusing solely on “government” employees. That can mean different types of government, such as state and local government employees, which are included in the overall government sector.
Below is an excerpt from the table that BLS publishes in its monthly employment report, with the number of total employees in the government sector in Feb 2025 and the change from the previous month (in thousands):
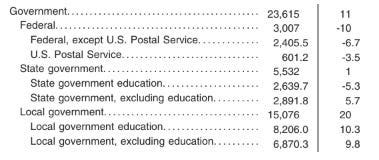
As you can see, the federal government only accounts for 3 million workers out of 23.6 million workers in all of the government sector, or 12.7%. State governments have 5.5 million workers, or 23.4%. And the big one is local governments, which account for 15 million government workers, or 65% of all government workers.
You’d think this was a conservative Republican’s wet dream, to have so much government power and administration confined to the local level, with essentially no growth whatsoever in the federal government bureaucracy. But apparently even this isn’t good enough for them.
DOGE is focused on the federal government specifically. Therefore, we really should be separating that sector out of the “government” data.
Below is the just the federal government workforce level during the same time span used in the previous graphs:

Hmm, this actually paints quite a different picture, doesn’t it?
(NOTE: the spikes you see throughout the graph are due to the years the Census count is conducted at the beginning of every decade, when the federal gov’t goes on a temporary hiring frenzy).
The number of federal government workers went from 2.3 million to 3 million, an increase of 30.4%. This is well below the labor force growth rate of 150% and the population growth rate of 100%.
You can see an obvious sharp increase in the late 1960s, likely due to the additions of Medicaid and Medicare to the federal government bureaucracy during the War on Poverty policies that occurred during this time period.
Just after this spike upward, the federal government workforce went as high as 2.9 million in 1969. As mentioned above, it currently sits at 3 million.
This means that the number of federal government employees has essentially remained unchanged from 1969 to today, a span of 56 years!
Thus, there has been literally no growth at all in the size of the federal “bureaucracy”.
The Shrinking Behemoth
In fact, when measured as a share of the total labor force and overall population, the federal government size has actually been steadily shrinking.
The share of the labor force that was federal government workers in 1959 was 3.4% and is now 1.79%—essentially cut in half. The share of the U.S. population in 1959 that was federal government workers was 1.32% and is now .88%—not quite cut in half, but significantly lower. See below graph:
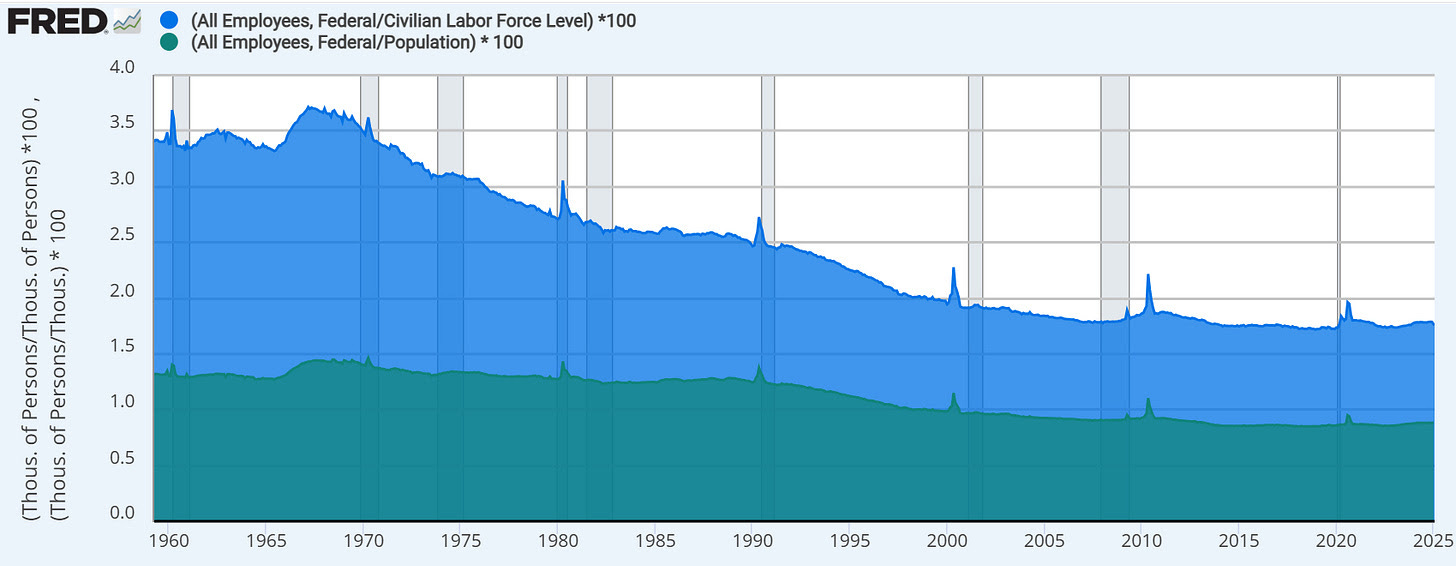
The share of both the overall population and the civilian labor force that federal government employees make up has been going significantly LOWER for decades.
But an interesting thing is that this trend lower actually shifted and reversed course during the first Trump administration.
Here’s the continuation of the trend lower that occurred under the eight years of the Obama administration:
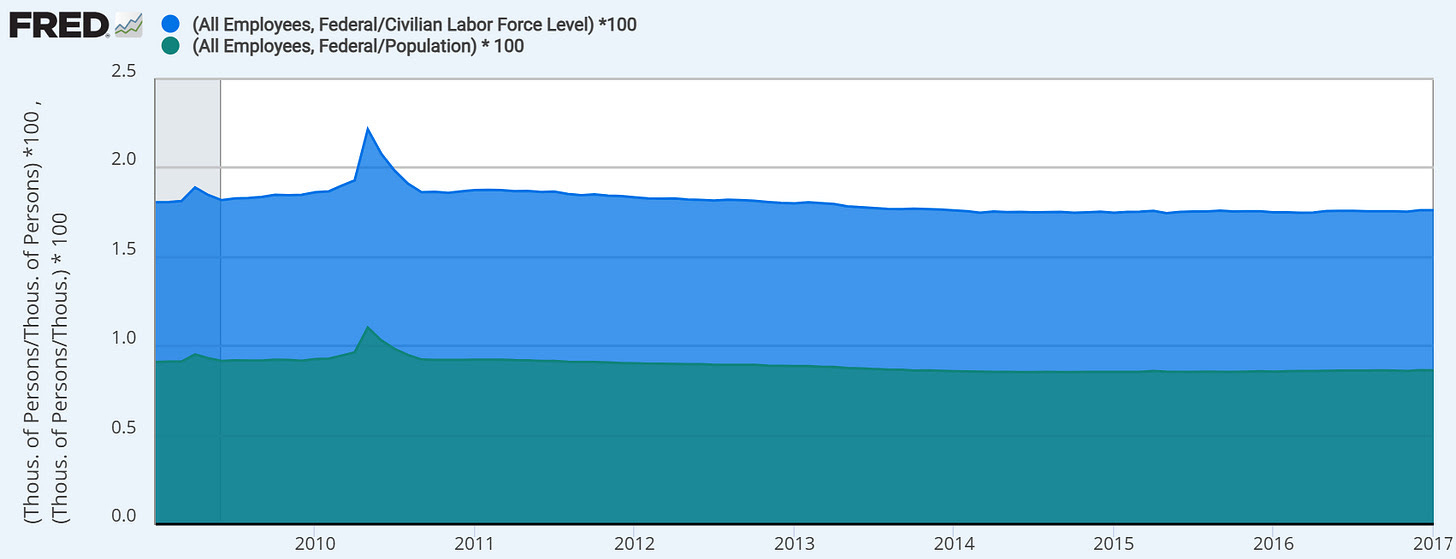
The shares of the labor force and general population that consist of federal workers went from 1.81% and .91%, respectively, to 1.76% and .86% during this time span, a small, but decreasing, amount.
Let’s look at how this changed during the first Trump administration:

The share of the labor force and population that federal workers made up actually increased during Trump’s first term, from 1.759% and .862% to 1.803% and .869%, respectively.
You can argue that his last full year in office was a Census year, when federal government hiring typically spikes, so these numbers may be skewed a bit higher. This is a solid argument. But MAGA is not known for bestowing the benefits of nuance onto others’ arguments, so why should we give them that benefit here?
The federal bureaucracy is not growing, remains a small share of both the overall and government labor force, is shrinking relative to population and labor force growth, and only expanded under Trump’s first term.
Like most things MAGA takes on, they’ve created a hysteria and a fog of crisis about something that is simply not there.
Turns out MAGA is the bloated behemoth, perpetrating destructive chaos on the country for no reason whatsoever.
If you would like to support The Banter and our mission, you can get 50% off a membership below:
Read more on The Banter:

The reason for the start year of 1959 is because some of the data used in these charts don’t start until that point.
 | A guest post by
|
Great article. Exposes the lies so clearly. The only bloat in government is Agent Orange’s behind.
National debt is now as high as it was in 1946. After 10 years depression five years of worldwide war. We are the wealthiest nation in the history of humankind. But we still can’t resist charging more and more and more on the national credit card. we are literally in the house. Interest on the national debt is now the biggest expenditure of government.
.
This is how nations fail. This is how we become unable to pay our Social Security and medical care.
.
We have all been reading articles about waste and fraud for decades. This is the very first time in my lifetime. Anyone has made a serious attempt to cut fraud and waste.
.
Write some constructive advice to help the process or shut up and sit down.
.